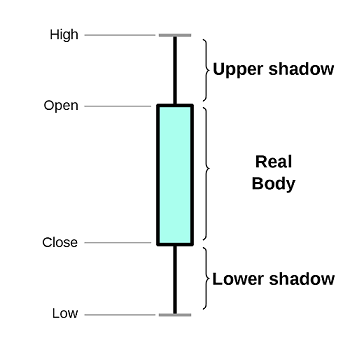
Shadow is a line that can be found in a candlestick chart. It is used to indicate the time at which the price for an asset fluctuated relative to the opening and closing prices. One can say that shadows illustrate the highest and lowest prices at which a particular security was traded over a specific time period of time.