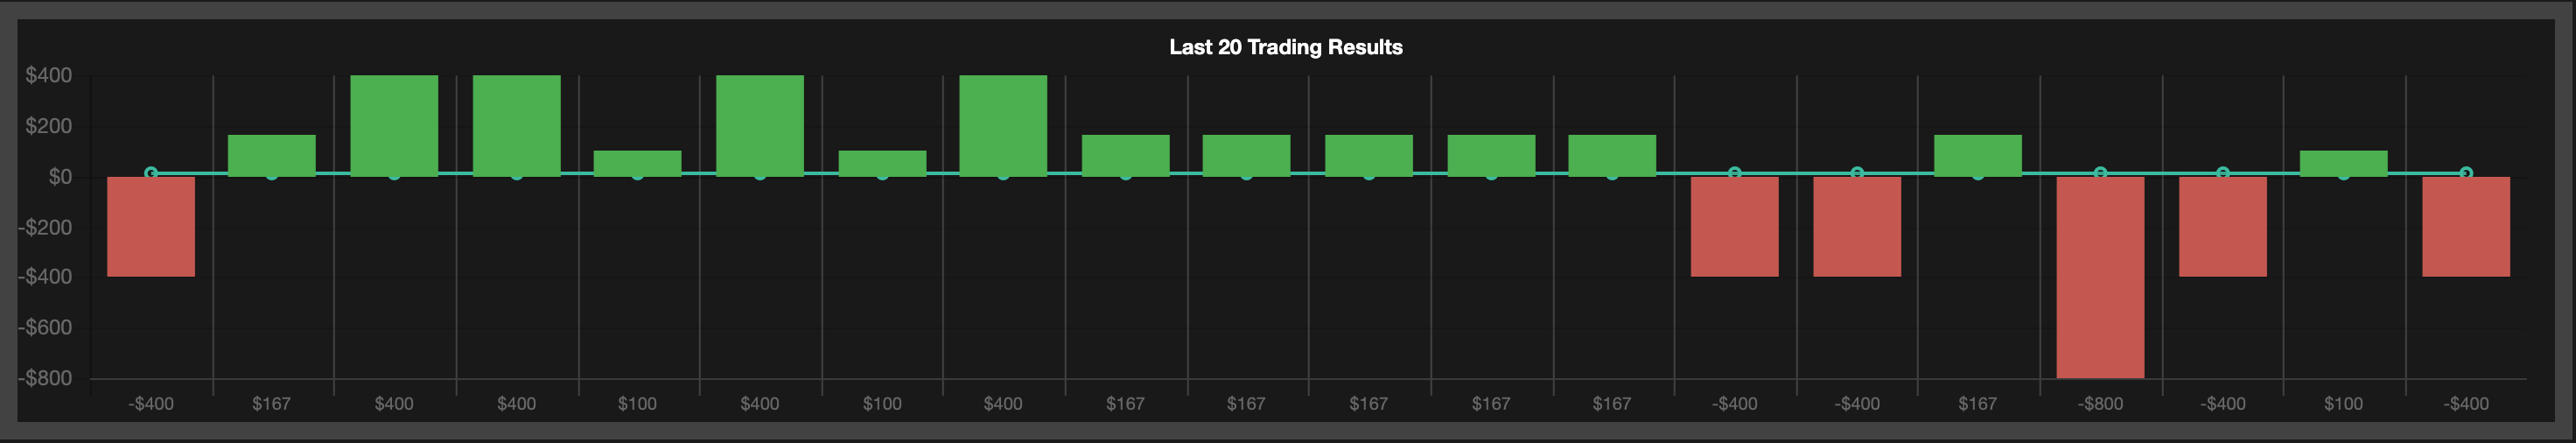
The first chart is now showing the last 20 Signals that was used
Red is negative outcome | Green is positive results with different amounts of results
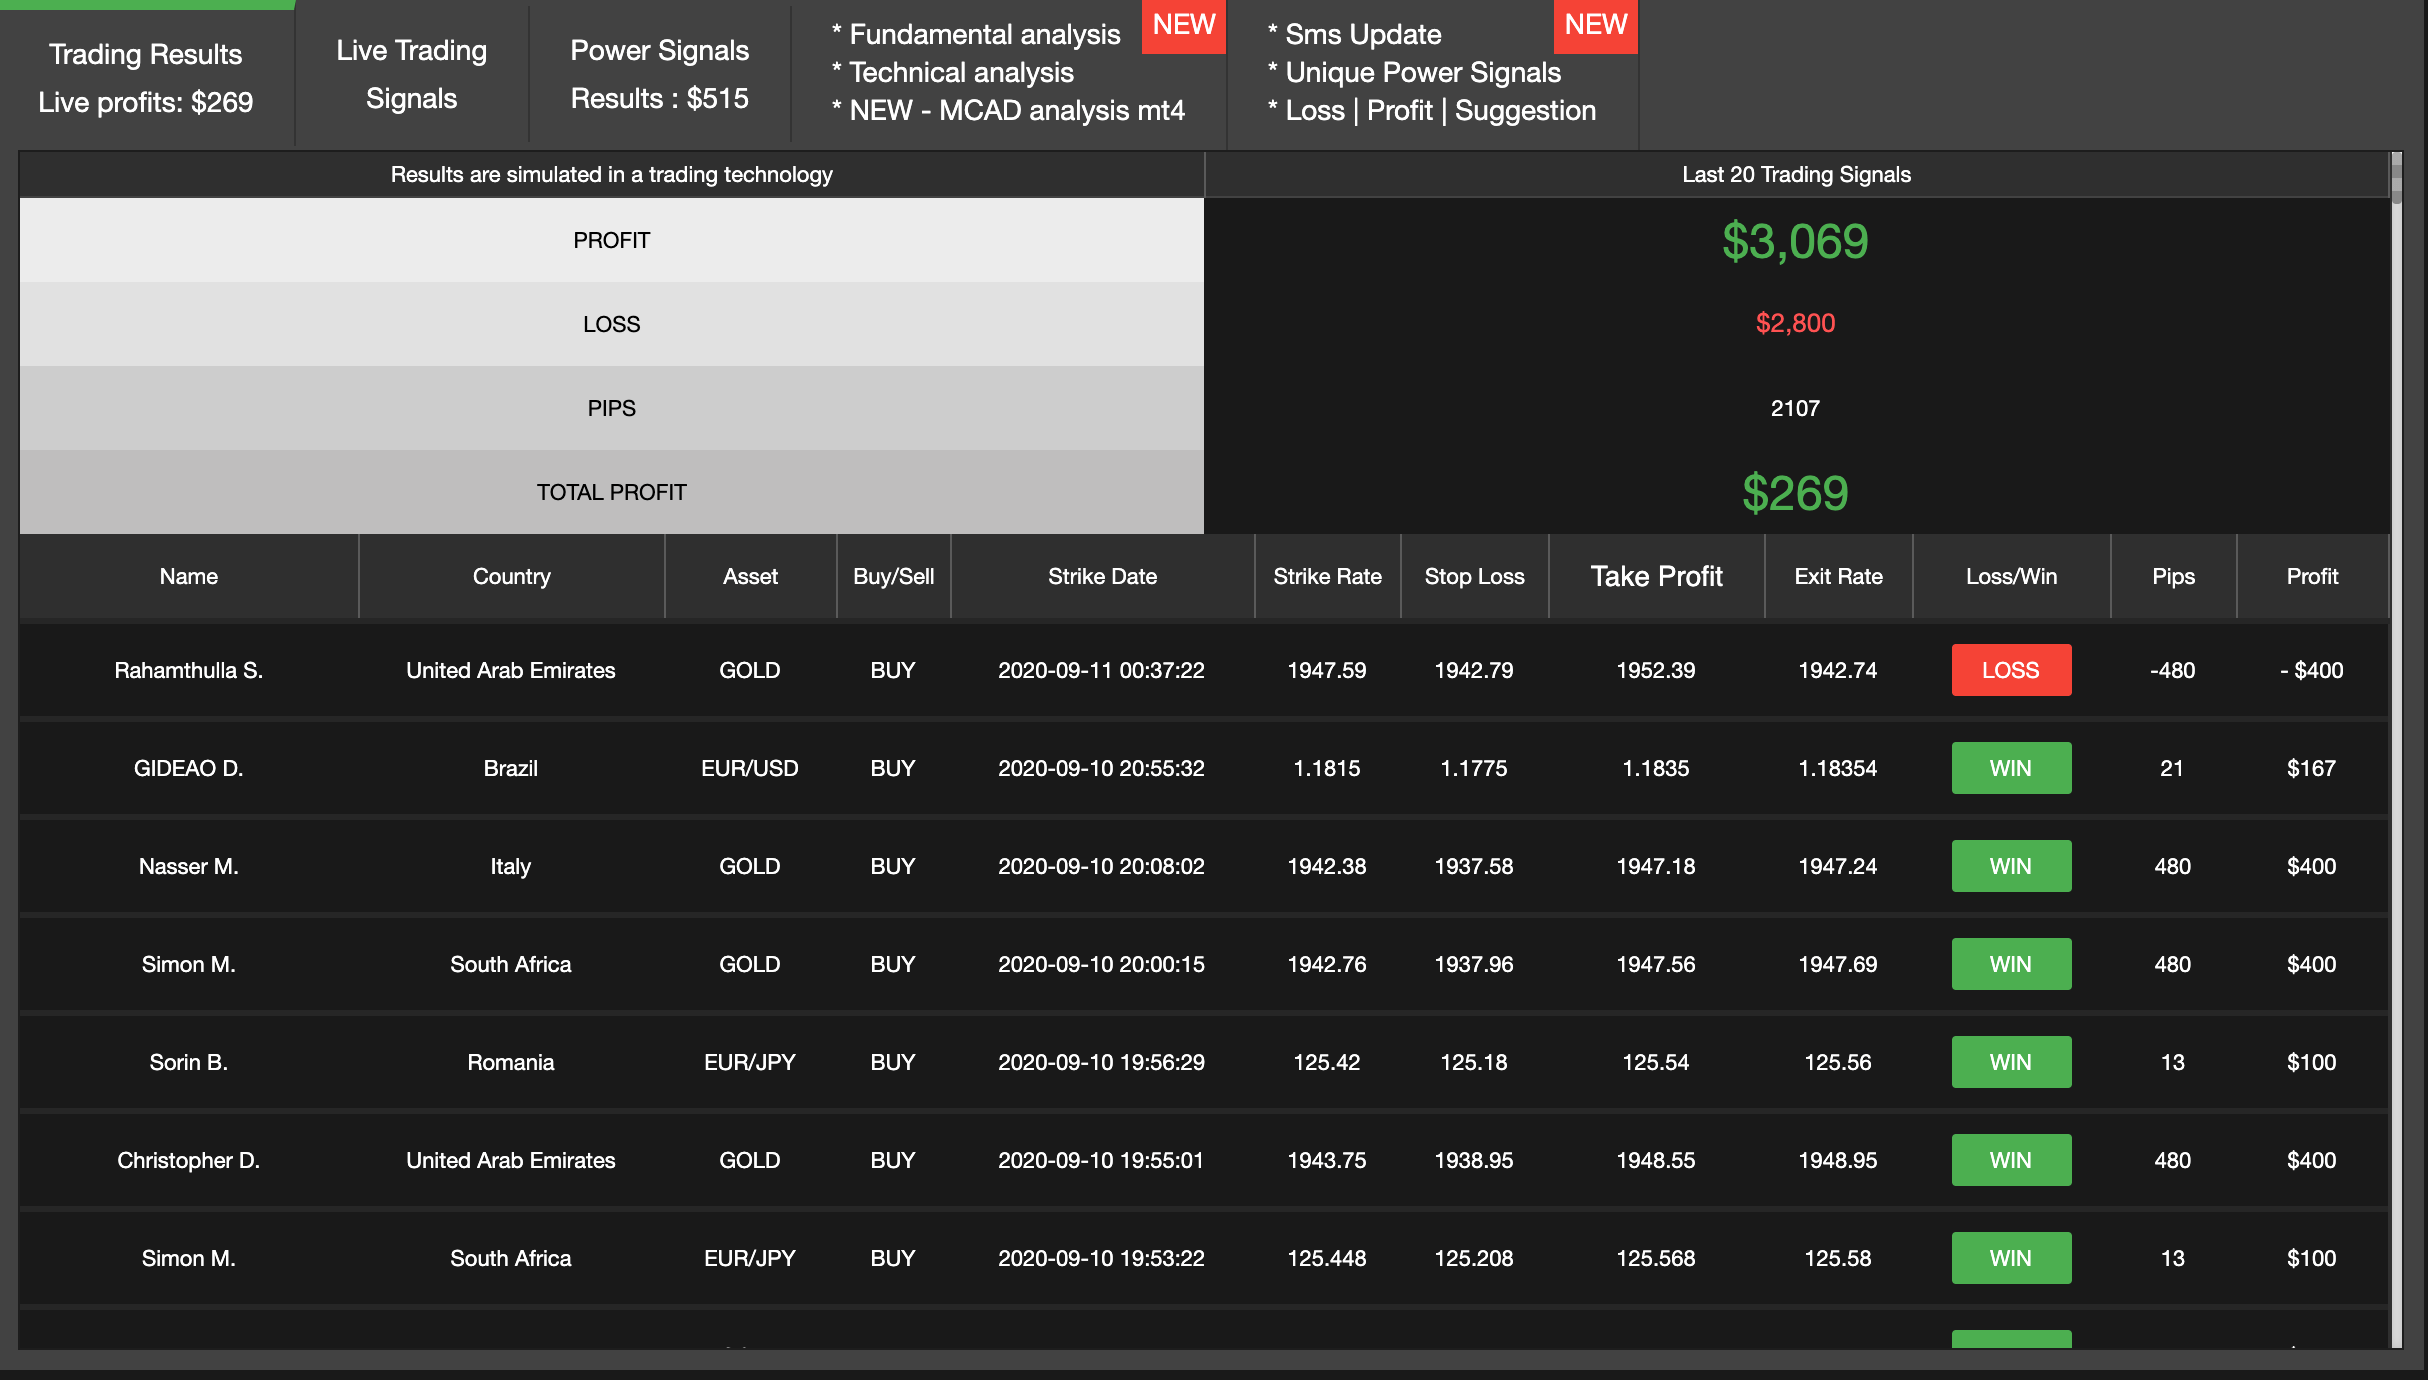
Trading results show the statistics of the most recent signals that are closed
You as a member can find your name near the closed signal
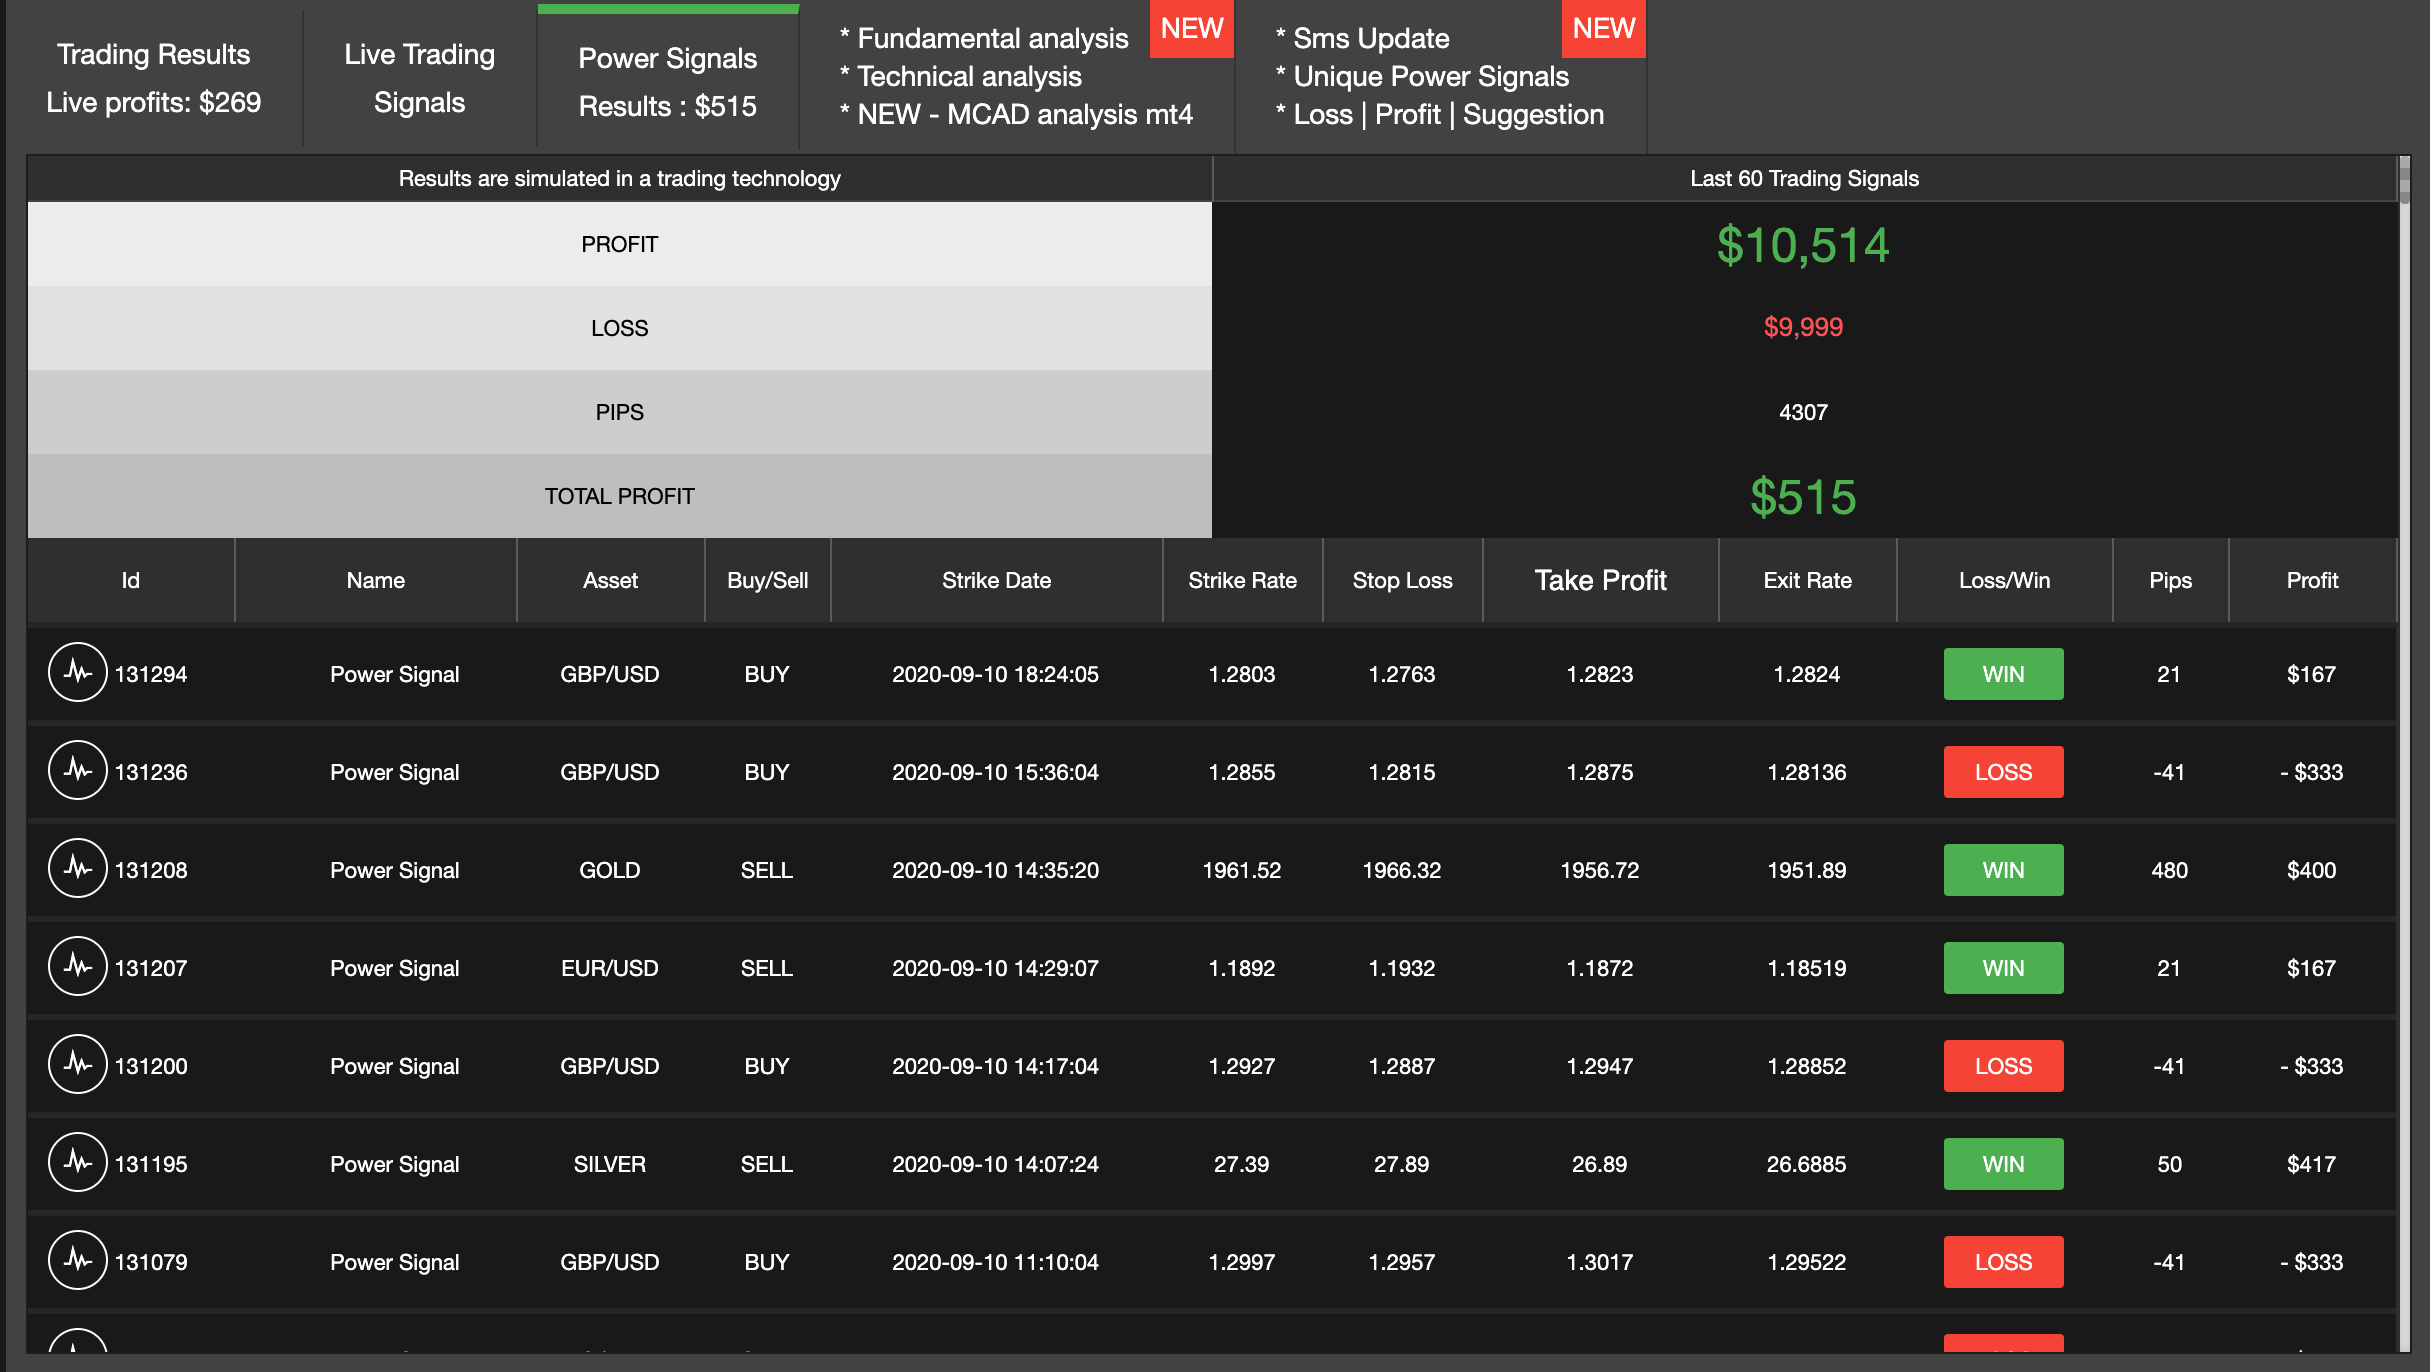
Power Signals works by finding the market week point and provide an SMS to our members
last 60 trades were not the most profitable nevertheless the outcome, in the end, is still in GREEN and profitable result
Usually Power Signals it is one of the strongest outcomes - ask the support to activate them for you